Most people who take weight loss (or gain) seriously want to know how to calculate body fat percentage.
That’s because tracking your body fat percentage over time (especially when trying to gain or lose weight) helps you measure the effectiveness of your diet and training plan.
Specifically, tracking your body fat percentage helps you to understand how successfully you’re . . .
- Losing fat and not muscle during a weight loss phase (or cut)
- Gaining muscle and not just fat during a weight gain phase (or lean bulk)
In this article, you’ll learn everything you need to know about body fat percentage, including how to calculate your body fat percentage accurately at home.
What Is Body Fat Percentage?
Your body fat percentage is the percentage of your body weight that’s fat.
For example, if you weigh 150 pounds and have 15 pounds of fat, your body fat percentage is 10% (15 / 150).
Your body fat percentage changes when you gain or lose fat, but also when you gain or lose muscle.
For instance, if you use proper diet and strength training to increase your weight from 150 to 170 pounds and gain just 5 pounds of fat, your new body fat percentage would be about 12% (20 / 170).
If you then stopped strength training for a year and lost 10 pounds of muscle but no fat, your body fat percentage would still be about 12% (20 / 160).
So, your body fat percentage ebbs and flows as you change your body composition.
How to Calculate Body Fat Percentage
There are numerous ways to measure your body fat percentage, though most aren’t nearly as accurate as you might think . . .
Body Composition Scales & Handheld Devices
Body composition scales and handheld devices are the simplest way to measure body fat percentage. Unfortunately, they’re also extremely inaccurate.
This is because of the way they analyze your body composition: bioelectrical impedance analysis (BIA).
BIA involves passing a light electrical current through your body and measuring resistance to it.
Muscle (being over 70% water) conducts electricity well, but fat (which contains less water) doesn’t, which is why the leaner you are, the more conductive your body is. In theory, then, you should be able to correlate levels of electrical resistance with levels of body fatness.
This hypothesis falls flat for several reasons:
1. Electricity will take the path of least resistance through your body, which means it will bypass fat for more conductive tissues.
For instance, if someone has a huge amount of subcutaneous fat, the current will avoid it and pass through internal tissue instead. This is perhaps why research shows that many two-electrode devices, like scales and handheld devices, are susceptible to missing entire portions of your body.
2. The body fat readings you get using BIA are predictions based on equations, and the methods used to create these equations often give inaccurate results.
3. Research shows that testing conditions can greatly influence the readings you get when you use BIA. Studies show being dehydrated will cause your body fat percentage to register higher than it is, eating a large meal will cause you to register leaner than you are, and exercising shortly before the measurement makes it appear that you have more muscle and less fat than you really do.
In the final analysis, BIA readings are just too all over the place to be useful, even if you attempt to control factors such as hydration, food, and exercise. Don’t waste your time or money on them.
Body Fat Calipers & Skinfold Testing
Skinfold testing involves using calipers to measure the thickness of your skin at certain points on your body.
These measurements are then added together and plugged into equations that extrapolate how much of your body is lean mass (everything that isn’t fat, including muscle) and fat mass.
Unsurprisingly, there are a couple of ways for this to go awry:
- If you grab too little skin and fat you’ll get a falsely low reading. Grab too much and you’ll inflate your readings.
- Research shows the equations used to convert skin thickness readings into a body fat percentage can spit out wonky results.
It’s no wonder studies show skinfold testing can miss the mark by up to 6%. This is true even when the testing is done by people who are familiar with how calipers work, like bodybuilders and personal trainers.
That said, although skinfold testing isn’t a foolproof method for determining body composition, it has its uses (more on this in a moment).
Pictures and the Mirror
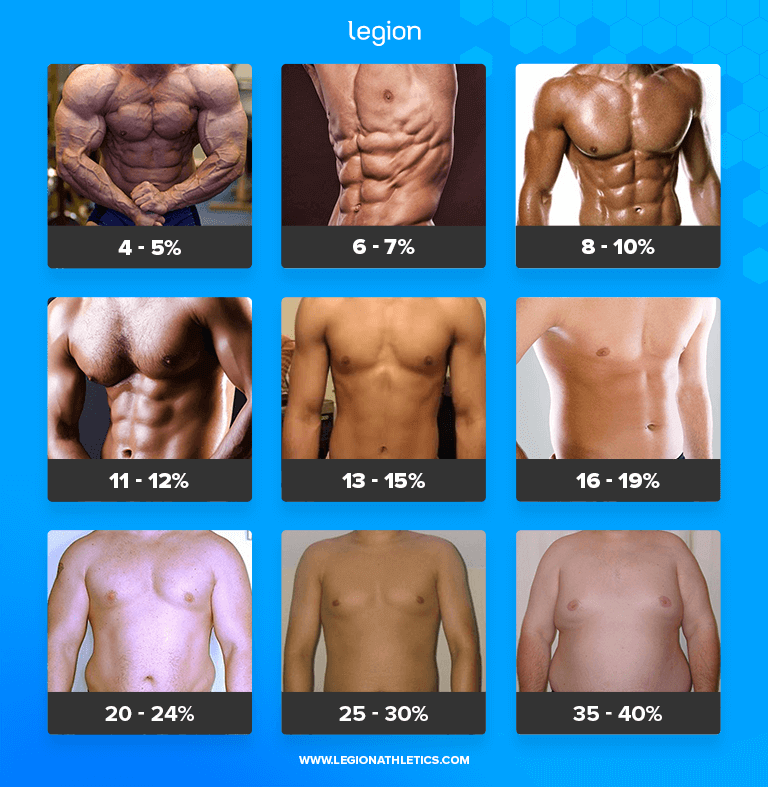
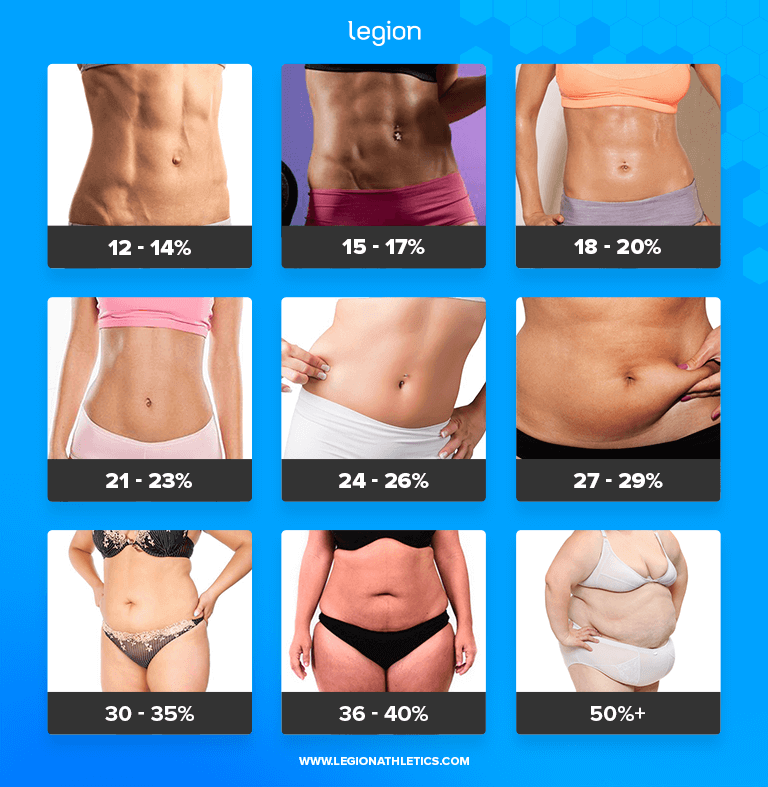
It’s tricky to estimate someone’s body composition simply by looking at them.
This is because the visual appearance of various body fat percentages can vary quite a bit depending on how much muscle people have.
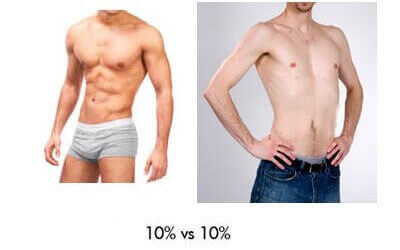
For example, an average looking guy at 160 pounds and 10% body fat has about 16 pounds of fat.
A muscular guy at 190 pounds and 10% body fat has only 3 pounds more fat but a whopping 27 pounds more lean mass.
As you can imagine, these two guys are going to look very, very different. Here’s what I mean:

Both are around 10% body fat but the one on the left has significantly more muscle, giving him a dramatically different look.
This can make it hard to estimate body fat percentages based on what you see in a picture or mirror, but the following images are a good guideline:


Dual-Energy X-Ray Absorptiometry (DXA)
DXA involves a full-body x-ray to determine total fat and fat-free mass.
This is possible because bone and different body tissues absorb x-ray energy differently.
You’ve probably heard that DXA is a foolproof method of measuring your body fat percentage, but it’s not.
There are several reasons for this:
- Results can vary between machines, even if they’re produced by the same manufacturer.
- Algorithms used to convert raw data into body composition measurements differ and thus outputs can differ.
- The type of X-ray used influences the results.
- Like BIA, hydration status can significantly impact DXA results (even minor changes in the hydration levels of lean mass can be enough to skew results).
- Results are affected by gender, body size, total fat mass, and even disease state.
For example, two studies found that individual error rates using DXA went as high as 4% (absolute!).
In another study, individual error rates in the range of 8-to-10% were seen. In yet another, DXA significantly overestimated decreases in body fat and underestimated increases.
The Bod Pod
The Bod Pod is a machine that measures the amount of air your body displaces inside a sealed chamber and uses equations to translate this into an analysis of body composition.
However, the Bod Pod’s results are affected by all kinds of things like . . .
. . . which is why studies show that it can be off by between 5 and 15%.
Magnetic Resonance Imaging (MRI)
An MRI scanner uses magnetic fields and radio waves to produce detailed, 2D images of the inside of your body.
Technicians then carefully analyze the images (a procedure known as postprocessing) to measure how much of your body mass is made up of fat.
The accuracy of MRI is largely dependent on how many of these images are taken. Research shows that trying to estimate body fat based on a sparse set of “slices” gives an imprecise reading of body composition.
Unfortunately, unless you’re willing to part with large sums of money and spend a considerable amount of time in the thin tube of an MRI scanner, the body composition data you get from MRI is not particularly accurate.
This is why MRI is generally only used to measure body composition in scientific studies, where many images can be taken.
How to Calculate Body Fat Percentage at Home Accurately
Calculating your body fat percentage at home isn’t difficult, but it does require a little know-how (especially when it comes to using body fat calipers).
Here’s a quick rundown:
First, you’ll need:
- Body fat calipers
- A scale
- A measuring tape
- A mirror
And here’s what to do with them . . .
Weigh yourself daily and calculate an average every 7 to 10 days.
Your weight fluctuates every day due to things like water retention, glycogen storage, and bowel movements (or the lack thereof).
That’s why flogging yourself over small unwanted increases or decreases in weight is silly and counterproductive. Instead, work with weekly averages, which will show you what’s really happening with your weight.
Weigh yourself first thing every morning, naked, after the bathroom and before eating or drinking anything
Then, after seven days, add up your readings and divide the sum by seven. That’s your average weight for that week.
Watch those averages over time and you’ll be able to see if things are actually moving in the right direction or not. A good rule of thumb is to only adjust your diet and training regimen if your weight is stalled for two weeks or more.
Take weekly caliper measurements.
Extrapolating body fat percentage from caliper measurements is hit and miss, but the measurements themselves are quite useful.
That is, while it’s not wise to put too much stock in the precise body fat percentage estimates from equations based on caliper measurements, here’s what you can bank on:
If your skin is getting thicker over time, you’re gaining fat. If it’s getting thinner, you’re losing fat.
In terms of what caliper to use, I like the Accu-Measure skinfold caliper because it’s affordable, easy to use, and as accurate as more expensive models.
Since it’s possible to lose or gain fat faster in some places than others, I recommend you take three skinfold measurements in various places on your body:
- If you’re a woman, take a triceps, thigh, and suprailiac measurement.
- If you’re a man, take a pectoral, abdominal, and thigh measurement.
And if you have your heart set on using these measurements to compute your body fat percentage, and are prepared to take the results with a grain of salt, you can use the Legion Body Fat Percentage Calculator to estimate your body composition.
Take weekly waist measurements.
The size of your waist (measured at the belly button) is a reliable indicator of fatness.
If your waist is shrinking over time, you’re losing fat. If it’s growing, you’re gaining fat.
And that’s why I recommend that you note down your waist measurement weekly.
There’s nothing fancy that you need for this—a simple measuring tape will do. That said, you’ll probably find this model from MyoTape easier to use, especially if you don’t have a friend to help take your measurements.
Take weekly pictures.
What you see in the mirror is, ultimately, what matters most.
If you’re gaining muscle and losing fat, you’re going to look better and better, regardless of what the scale or anything else says.
So, take weekly front, back, and side pictures in good, consistent lighting and over time your progress (or lack thereof) will be easy to see.
If you want to learn more about the art and science of measuring your body fat percentage, check out my bestselling fitness books Bigger Leaner Stronger for men, and Thinner Leaner Stronger for women.
How to Calculate Body Fat Percentage from BMI
BMI stands for body mass index, which is a numeric expression of the relationship between your height and weight.
While it’s a quick and convenient way to estimate whether you are a healthy weight for your height, it doesn’t measure your body fat percentage directly, and thus can’t be used to predict body fat percentage accurately.
That said, researchers have tried for decades to come up with an equation that uses BMI to accurately calculate body fat percentage.
The most recent of these equations states that body fat percentage is . . .
(1.39 x BMI) + (0.16 x age) – (10.34 x gender) – 9 = Body Fat Percentage
(In this case, “gender” is equal to 1 for men and 0 for women. This accounts for men’s lower body fat percentage.)
To use this formula, you’d first calculate your BMI using the Legion BMI Calculator. For example, I’m 37 years old, 6’1 and weigh about 190 pounds, which means my BMI is about 25.
Here’s what the math would look like for me . . .
(1.39 x 25) + (0.16 x 37) – (10.34 x 1) – 9 = Body Fat Percentage
34.75 + 5.92 – 10.34 – 9
40.67 – 19.34 = 21.33% body fat
. . . which is exactly why you can’t use BMI to estimate body fat percentage.
In reality, I’m currently sporting a six-pack at about ~9-to-10% body fat, or about half what this formula predicted.
This doesn’t mean this formula is useless, but it has a major limitation: it was designed and is best suited for estimating the body fat percentage of people with average levels of body fat (anywhere from 15-to-25% or so), and considerably less accurate if you’re very lean, or overweight.
If you want to accurately calculate your body fat percentage, you’re better off steering clear of BMI equations and using caliper and waist measurements and pictures instead.
FAQ #1: What’s the ideal body fat percentage?
There’s no “ideal” body fat percentage for health, fitness, and aesthetics.
Instead, it’s better to think of ideal ranges of body fat based on your goals.
If your goal is to look athletic, stay healthy, and avoid disease, then you should aim for a body fat percentage of around 20-to-25% for women and 10-to-15% for men. Getting leaner than that isn’t necessary for health purposes.
If your goal is to stay impressively lean and you’re willing to be very strict about your diet, then you should aim for a body fat percentage of 18-to-19% (women) or 8-to-9% (men).
This isn’t generally sustainable long term, and I don’t recommend you try to maintain this level of leanness year round, but it’s doable for short periods of time, such as during the summer.
FAQ #2: How lean do I need to be to get great abs?
Men usually need to be below 10% body fat to see clear separation between their abdominal muscles, and women usually need to be below 20%.
Luckily getting to this body fat percentage is easy to do. A bit of proper dieting, weightlifting, some cardio, and a little patience is all it takes.
FAQ #3: What’s the lowest body fat percentage I can maintain?
This varies from person to person, but typically, the lowest body fat percentage you can maintain for more than a few months is 8-to-10% for men and 18-to-20% for women.
Try to maintain a lower body fat percentage than this for longer than this, and you can run into a long list of negative consequences, including:
What’s more, muscle and strength gain will also be impaired if not stopped altogether, which is why staying this lean can be counterproductive over the long haul.
FAQ #4: How do I lower my body fat percentage?
Reducing your body fat percentage is mostly a matter of controlling and optimizing your diet and doing a moderate amount of strength training. Since diet is the long pole in the tent when it comes to fat loss, here are a few tips for proper dieting:
1. Determine how many calories you should eat every day.
Research shows that eating 20-to-25% fewer calories than you burn every day will help you lose fat lickety-split without losing muscle or wrestling with excessive hunger, lethargy, and the other hobgoblins of low-calorie dieting.
2. Determine how much protein, carbohydrate, and fat you should eat every day.
If you want to lower their body fat percentage without encountering problems with body composition, workout performance, and overall health and well-being . . .
- Set your protein intake to 40% of your total daily calories.
- Set your carbohydrate intake to 40% of your total daily calories.
- Set your fat intake to 20% of your total daily calories
3. Create a meal plan based on these numbers.
Or, if you’d like professional help putting a meal plan together (not to mention guaranteed results), click here to learn about my diet coaching service.
FAQ #5: What is the average body fat percentage?
In the United States, the average body fat percentage for men is 28%, and the average body fat percentage for women is 40%.
In other words, most Americans have about twice as much body fat as they should in order to look athletic and stay healthy.
+ Scientific References
- St-Onge, M.-P. (2010). Are Normal-Weight Americans Over-Fat? Obesity (Silver Spring, Md.), 18(11), 2067–2068. https://doi.org/10.1038/OBY.2010.103
- HT, H., JJ, H., J, I., H, K., R, P., T, K., K, M., & AA, M. (2015). Body composition and power performance improved after weight reduction in male athletes without hampering hormonal balance. Journal of Strength and Conditioning Research, 29(1), 29–36. https://doi.org/10.1519/JSC.0000000000000619
- Sundgot-Borgen, J., Meyer, N. L., Lohman, T. G., Ackland, T. R., Maughan, R. J., Stewart, A. D., & Müller, W. (2013). How to minimise the health risks to athletes who compete in weight-sensitive sports review and position statement on behalf of the Ad Hoc Research Working Group on Body Composition, Health and Performance, under the auspices of the IOC Medical Commission. British Journal of Sports Medicine, 47(16), 1012–1022. https://doi.org/10.1136/BJSPORTS-2013-092966
- Jackson, A. S., Stanforth, P. R., Gagnon, J., Rankinen, T., Leon, A. S., Rao, D. C., Skinner, J. S., Bouchard, C., & Wilmore, J. H. (2002). The effect of sex, age and race on estimating percentage body fat from body mass index: The Heritage Family Study. International Journal of Obesity, 26, 789–796. https://doi.org/10.1038=sj.ijo.0802006
- Heo, M., Faith, M. S., Pietrobelli, A., & Heymsfield, S. B. (2012). Percentage of body fat cutoffs by sex, age, and race-ethnicity in the US adult population from NHANES 1999–2004. The American Journal of Clinical Nutrition, 95(3), 594–602. https://doi.org/10.3945/AJCN.111.025171
- W, S., J, C., M, G., G, V., M, P., & SB, H. (2012). A single MRI slice does not accurately predict visceral and subcutaneous adipose tissue changes during weight loss. Obesity (Silver Spring, Md.), 20(12), 2458–2463. https://doi.org/10.1038/OBY.2012.168
- Thomas, E. L., & Bell, J. D. (2003). Influence of undersampling on magnetic resonance imaging measurements of intra-abdominal adipose tissue. International Journal of Obesity 2003 27:2, 27(2), 211–218. https://doi.org/10.1038/sj.ijo.802229
- MA, C., ML, M.-S., EM, E., TK, S., KJ, C., & LB, R. (2004). Effect of race and musculoskeletal development on the accuracy of air plethysmography. Medicine and Science in Sports and Exercise, 36(6). https://doi.org/10.1249/01.MSS.0000128182.76254.05
- DA, F., GD, W., LB, G., GR, H., DD, P., & MI, G. (2001). Comparison of the BOD POD with the four-compartment model in adult females. Medicine and Science in Sports and Exercise, 33(9), 1605–1610. https://doi.org/10.1097/00005768-200109000-00026
- MA, C., ML, M.-S., EM, E., TK, S., KJ, C., & LB, R. (2004). Effect of race and musculoskeletal development on the accuracy of air plethysmography. Medicine and Science in Sports and Exercise, 36(6), 1070–1077. https://doi.org/10.1249/01.MSS.0000128182.76254.05
- DA, F., GR, H., & MI, G. (2000). Validation of the BOD POD with hydrostatic weighing: influence of body clothing. International Journal of Obesity and Related Metabolic Disorders : Journal of the International Association for the Study of Obesity, 24(2), 200–205. https://doi.org/10.1038/SJ.IJO.0801113
- DA, F., PB, H., & GR, H. (2004). Assessment of body composition by air-displacement plethysmography: influence of body temperature and moisture. Dynamic Medicine : DM, 3(1), 1–7. https://doi.org/10.1186/1476-5918-3-3
- PB, H., DA, F., GR, H., & BA, G. (2001). Effect of scalp and facial hair on air displacement plethysmography estimates of percentage of body fat. Obesity Research, 9(5), 326–330. https://doi.org/10.1038/OBY.2001.41
- JL, C., JA, K., L, W., SB, H., CD, T., ME, G., MO, T., ML, H., & A, W. (1999). Validity of methods of body composition assessment in young and older men and women. Journal of Applied Physiology (Bethesda, Md. : 1985), 86(5), 1728–1738. https://doi.org/10.1152/JAPPL.1999.86.5.1728
- EM, E., MJ, S., MA, S., SA, A., RD, L., & KJ, C. (1999). Body-composition changes with diet and exercise in obese women: a comparison of estimates from clinical methods and a 4-component model. The American Journal of Clinical Nutrition, 70(1), 5–12. https://doi.org/10.1093/AJCN/70.1.5
- WD, van M. L., F, H., NB, V., S, E., & H, K. (2004). Body composition changes in bodybuilders: a method comparison. Medicine and Science in Sports and Exercise, 36(3), 490–497. https://doi.org/10.1249/01.MSS.0000117159.70295.73
- GE, V. D. P., RT, W., & J, L. (2003). Percent body fat via DEXA: comparison with a four-compartment model. Journal of Applied Physiology (Bethesda, Md. : 1985), 94(2), 499–506. https://doi.org/10.1152/JAPPLPHYSIOL.00436.2002
- JE, W., JC, W., CM, W., D, H., A, L., & MS, F. (2006). Evaluation of Lunar Prodigy dual-energy X-ray absorptiometry for assessing body composition in healthy persons and patients by comparison with the criterion 4-component model. The American Journal of Clinical Nutrition, 83(5), 1047–1054. https://doi.org/10.1093/AJCN/83.5.1047
- BM, P., KJ, C., CM, M., EM, E., MA, S., M, S., & RD, L. (1997). In vivo validation of whole body composition estimates from dual-energy X-ray absorptiometry. Journal of Applied Physiology (Bethesda, Md. : 1985), 83(2), 623–630. https://doi.org/10.1152/JAPPL.1997.83.2.623
- E, I., J, P., J, W., SB, H., JC, T., M, H., D, G., & RN, P. (2003). Pencil-beam versus fan-beam dual-energy X-ray absorptiometry comparisons across four systems: appendicular lean soft tissue. Acta Diabetologica, 40 Suppl 1(SUPPL. 1). https://doi.org/10.1007/S00592-003-0034-X
- WD, van M. L., F, H., NB, V., S, E., & H, K. (2004). Body composition changes in bodybuilders: a method comparison. Medicine and Science in Sports and Exercise, 36(3), 490–497. https://doi.org/10.1249/01.MSS.0000117159.70295.73
- EM, E., MJ, S., MA, S., SA, A., RD, L., & KJ, C. (1999). Body-composition changes with diet and exercise in obese women: a comparison of estimates from clinical methods and a 4-component model. The American Journal of Clinical Nutrition, 70(1), 5–12. https://doi.org/10.1093/AJCN/70.1.5
- MJ, P., SA, C., & RM, S. (2003). Development and validation of skinfold-thickness prediction equations with a 4-compartment model. The American Journal of Clinical Nutrition, 77(5), 1186–1191. https://doi.org/10.1093/AJCN/77.5.1186
- AS, J., & ML, P. (1978). Generalized equations for predicting body density of men. The British Journal of Nutrition, 40(3), 497–504. https://doi.org/10.1079/BJN19780152
- M, A. K., MJ, M., S, R., PL, P., GR, H., & RL, W. (1988). Electrical impedance in assessing human body composition: the BIA method. The American Journal of Clinical Nutrition, 47(5), 789–792. https://doi.org/10.1093/AJCN/47.5.789
- F, S., & L, R.-H. (2001). Bioelectrical impedance: effect of 3 identical meals on diurnal impedance variation and calculation of body composition. The American Journal of Clinical Nutrition, 74(4), 474–478. https://doi.org/10.1093/AJCN/74.4.474
- HC, L., WW, B., CB, H., & WA, S. (1986). Validation of tetrapolar bioelectrical impedance method to assess human body composition. Journal of Applied Physiology (Bethesda, Md. : 1985), 60(4), 1327–1332. https://doi.org/10.1152/JAPPL.1986.60.4.1327
- JA, B.-K., B, B., & P, D. (1996). Measurement of body fat in young and elderly women: comparison between a four-compartment model and widely used reference methods. The British Journal of Nutrition, 75(5), 649–657. https://doi.org/10.1079/BJN19960170
- A, B.-W., W, L., B, H., T, S., E, K., CC, G., M, H., & MJ, M. (2008). Accuracy of bioelectrical impedance consumer devices for measurement of body composition in comparison to whole body magnetic resonance imaging and dual X-ray absorptiometry. Obesity Facts, 1(6), 319–324. https://doi.org/10.1159/000176061
If you enjoyed this article, get weekly updates. It’s free.
Sending…
Great! You’re subscribed.
100% Privacy. We don’t rent or share our email lists.


